
 Delaware (USA)
  Vietnam
  Singapore
  Hong Kong
  United Kingdom
 Earnings Per Share (EPS) stands as one critical financial metric that every investor, analyst, and business professional must understand. This fundamental indicator serves as a cornerstone for evaluating company performance, making investment decisions, and assessing stock valuations. Whether applied by seasoned investors analyzing potential portfolio additions or by beginners learning the basics of financial analysis, mastering EPS calculation and interpretation is essential for making informed investment choices.
This article outlines essential aspects of Earnings Per Share (EPS) to provide investors and business professionals with a clearer understanding of its definition and practical implications. We specialize in company formation and do not offer legal or financial advice. For tailored guidance or investment-related decisions concerning EPS analysis, please consult a qualified financial or investment expert.
What are Earnings Per Share (EPS)?
Earnings Per Share (EPS) represents a fundamental financial metric that measures the amount of net profit available to common shareholders (after deducting preferred dividends, if any) for each outstanding common share, calculated using the weighted average number of common shares outstanding during a specific period. This metric essentially answers the question: "How much profit did the company generate for each share of stock owned by common shareholders?"
EPS serves as a standardized measure that allows investors to evaluate a company's profitability on a per-share basis, making it easier to compare companies of different sizes within the same industry. The metric indicates how efficiently a company converts its business operations into profits that benefit shareholders. A higher EPS generally suggests stronger profitability and better value creation for shareholders, while a declining EPS may signal operational challenges or increased competition.
The importance of EPS extends beyond simple profit measurement. For entrepreneurs considering business formation or using an incorporation service in Vietnam, understanding EPS can be valuable when evaluating potential investments or assessing the financial health of comparable companies in the same sector. Financial analysts and portfolio managers rely heavily on EPS trends to assess company performance and make recommendations to clients.
EPS calculation formula
The standard formula for calculating Earnings Per Share (EPS):
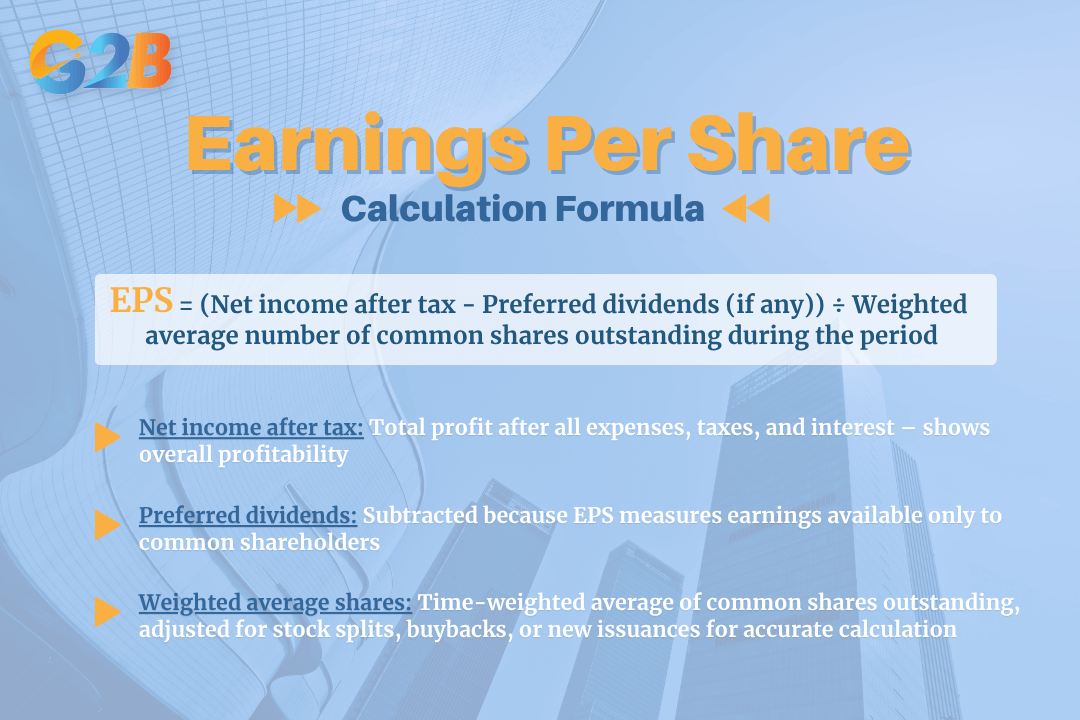
EPS = (Net income after tax - Preferred dividends (if any)) ÷ Weighted average number of common shares outstanding during the period
Understanding each component of this formula is crucial for accurate calculation and interpretation:
- Net income after tax represents the company's total profit after deducting all expenses, including taxes and interest, for the reporting period. This figure appears at the bottom of the income statement and reflects the company's overall profitability for the reporting period.
- Preferred dividends are payments made to preferred shareholders, if any, and must be subtracted from net income because EPS focuses specifically on earnings available to common shareholders. Preferred shareholders typically receive fixed dividend payments before common shareholders receive any distributions.
- Weighted average number of common shares outstanding during the reporting period represents the average number of common shares outstanding during the reporting period, adjusted for any changes in share count due to stock splits, buybacks, new issuances, and other corporate actions, calculated on a time-weighted basis. This weighted average approach ensures accuracy when share counts change throughout the period.
Understanding the EPS calculation formula is important to calculate accurately
Let's examine a practical example to illustrate the calculation:
- Company ABC reports net income of $2,500,000 for the fiscal year
- The company paid $250,000 in preferred dividends during the same period
- The weighted average number of common shares outstanding was 1,125,000 shares
- EPS = ($2,500,000 - $250,000) ÷ 1,125,000 = $2,250,000 ÷ 1,125,000 = $2.00 per share
This calculation reveals that Company ABC generated $2.00 in earnings for each outstanding common share, providing a clear metric for shareholders to evaluate their investment's profitability.
Common types of EPS
Understanding the different types of EPS calculations is essential for comprehensive financial analysis, as each type serves specific purposes and provides unique insights into company performance.
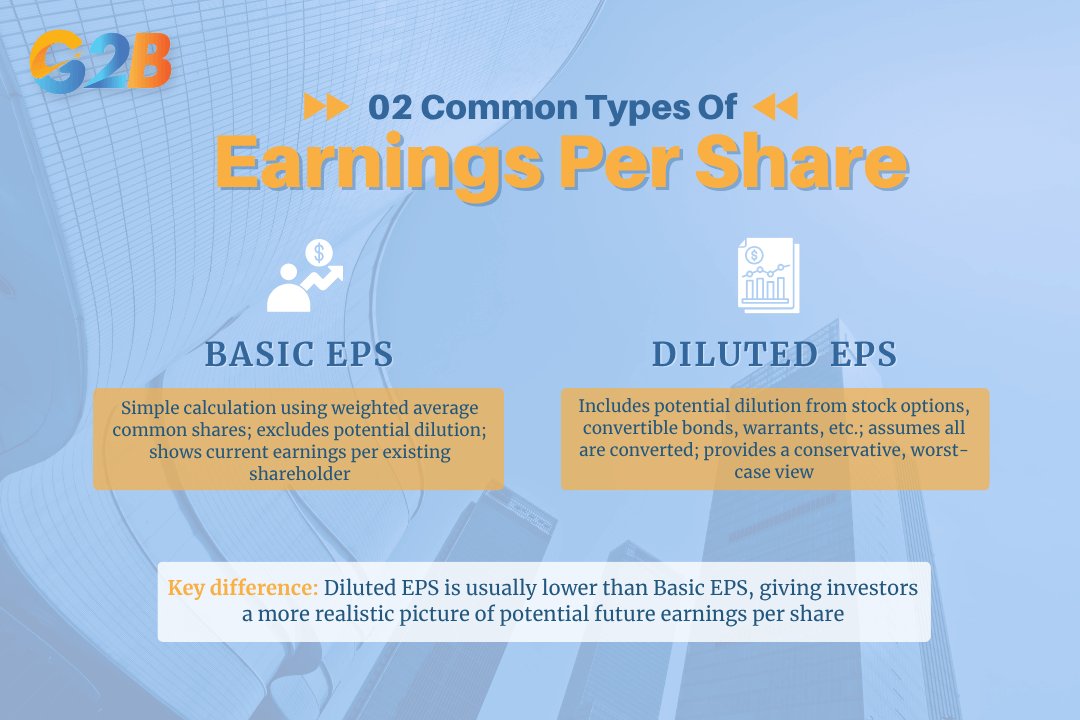
- Basic EPS represents the most straightforward calculation, using the weighted average number of outstanding common shares during the reporting period without considering any potential dilution from convertible securities. This metric provides a snapshot of current earnings distribution among existing shareholders and forms the foundation for more complex EPS calculations.
- Diluted EPS offers a more conservative and comprehensive view by accounting for potential dilution from convertible securities such as stock options, convertible bonds, warrants, and other instruments that could be converted into common shares during the reporting period. This calculation assumes that all dilutive securities are converted, presenting a worst-case scenario for existing shareholders regarding earnings dilution.
- The difference between basic and diluted EPS can be significant, particularly for companies with substantial convertible securities outstanding. Diluted EPS typically shows a lower value than basic EPS, reflecting the potential impact of increased weighted average share count on earnings per share. Investors often focus on diluted EPS as it provides a more realistic picture of potential future earnings per share.
Companies are required to report both basic and diluted EPS in their financial statements when applicable, in accordance with Vietnamese Accounting Standards and regulations, allowing investors to understand the full range of potential earnings scenarios. This dual reporting requirement ensures transparency and helps investors make more informed decisions about the company's true earning power per share.
There are 2 different types of EPS calculations with each type serving specific purposes
Significance and role of EPS
EPS holds tremendous significance in financial analysis and investment decision-making, serving multiple critical functions that extend far beyond simple profit measurement. As a key indicator of company profitability and operational efficiency, EPS provides investors with essential insights into how effectively management utilizes company resources to generate shareholder value.
The metric's primary role involves enabling comparative analysis across companies within the same industry, provided that the comparison is made between the same type of EPS (Basic or Diluted), to ensure consistency and accuracy. By standardizing earnings on a per-share basis, EPS allows investors to evaluate companies of different sizes and capital structures on equal footing. This standardization proves invaluable when building diversified portfolios or identifying the most attractive investment opportunities within specific sectors.
EPS also serves as a fundamental building block for numerous financial ratios and valuation methods. The Price-to-Earnings (P/E) ratio, one of the most widely used valuation metrics, directly incorporates EPS in its calculation. A company's P/E ratio equals its stock price divided by its EPS, providing investors with a standardized measure of how much they're paying for each dollar of earnings.
Furthermore, EPS trends over time reveal crucial information about company performance and management effectiveness. Consistent EPS growth typically indicates strong business fundamentals, effective cost management, and successful revenue generation strategies. Conversely, declining EPS may signal operational challenges, increased competition, or economic headwinds affecting the company's profitability.
How EPS is used in investment analysis
Investment professionals and individual investors utilize EPS in various sophisticated ways to make informed investment decisions and construct successful portfolios. The metric's versatility makes it applicable across different investment strategies and analytical approaches.
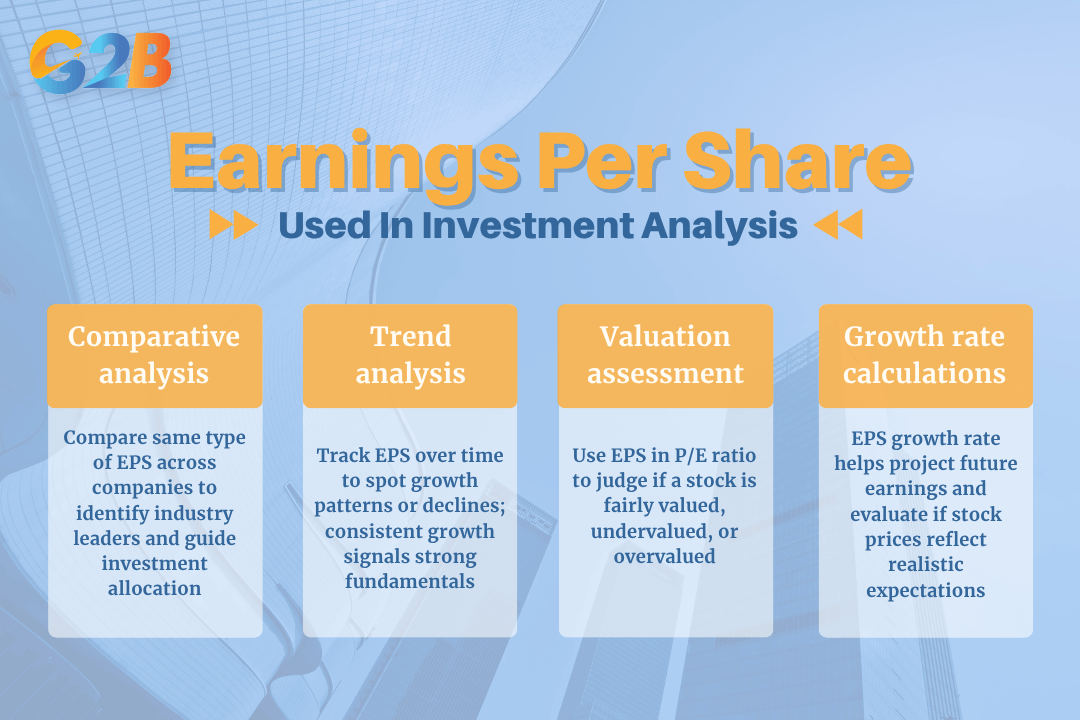
- Comparative analysis represents one of the most common applications of EPS in investment analysis. By comparing the same type of EPS (Basic or Diluted) figures across companies within the same industry, investors can identify which companies generate superior profitability per share. This comparison helps distinguish between industry leaders and laggards, guiding investment allocation decisions.
- Trend analysis involves examining EPS changes over multiple reporting periods to identify growth patterns or concerning declines. Investors typically analyze quarterly and annual EPS trends, ensuring adjustments for any changes in accounting standards or extraordinary items that might affect comparability. Companies demonstrating consistent EPS growth often command premium valuations due to their perceived reliability and growth potential.
- Valuation assessment combines EPS with stock price data to determine whether a stock is fairly valued, undervalued, or overvalued. The P/E ratio calculation directly incorporates EPS, allowing investors to assess whether they're paying a reasonable price for the company's earnings. Lower P/E ratios may indicate undervaluation, while higher ratios might suggest overvaluation or high growth expectations.
- Growth rate calculations utilize EPS data to determine earnings growth rates, which are essential for various valuation models. The EPS growth rate helps investors project future earnings and assess whether current stock prices reflect reasonable expectations for future performance.
Investment professionals and individual investors utilize EPS in various sophisticated ways
Limitations of EPS
Despite its widespread use and importance, EPS has several limitations that investors must understand to avoid misinterpretation and make more informed decisions. Recognizing these limitations helps investors use EPS more effectively while supplementing their analysis with additional metrics.
- Cash flow disconnect represents a significant limitation, as EPS reflects accounting earnings rather than actual cash generated by the company, which is especially important in the Vietnamese market given the variations in working capital management and accounting practices. A company might report strong EPS while experiencing cash flow problems due to accounting practices, timing differences, or working capital changes. This disconnect emphasizes the importance of analyzing cash flow statements alongside EPS figures.
- Accounting manipulation potential exists because management has some discretion in applying accounting policies and recognizing certain items, which may be used to smooth earnings or adjust EPS figures. Companies might use accounting techniques to smooth earnings or manipulate EPS figures to meet analyst expectations. This possibility highlights the need for investors to understand the quality of earnings behind reported EPS numbers.
- One-time items impact can significantly distort EPS calculations, making period-to-period comparisons difficult unless these items are properly identified and adjusted. Extraordinary gains or losses, restructuring charges, or other non-recurring items can artificially inflate or deflate EPS figures. Investors must identify and adjust for these items to understand the company's underlying operational performance.
- Diluted EPS complexity can make the metric difficult for non-professional investors in Vietnam to interpret accurately, especially given the relatively lower prevalence of convertible securities in the market. The assumptions and calculations involved in determining potential dilution from convertible securities require sophisticated understanding of financial instruments and their conversion mechanics.
Advanced EPS considerations
Professional investors and analysts often employ advanced techniques when analyzing EPS to gain deeper insights into company performance and future prospects. These sophisticated approaches help overcome some of the basic limitations associated with traditional EPS analysis.
- Adjusted EPS calculations remove the impact of one-time items, extraordinary gains or losses, and other non-recurring events as defined and disclosed under Vietnamese Accounting Standards to provide a clearer picture of underlying operational performance. This adjustment process helps investors understand the company's core earning power and make more accurate predictions about future performance.
- Forward-looking EPS involves analyzing analyst estimates and company guidance to assess future earnings potential. This forward-looking approach helps investors evaluate whether current stock prices reflect reasonable expectations for future EPS growth and identify potential investment opportunities.
- Sector-specific adjustments may be necessary when comparing EPS across different industries due to varying accounting practices, business models, and capital intensity requirements. Understanding these industry-specific factors helps investors make more meaningful comparisons and avoid misinterpreting EPS figures.
- Quality of earnings analysis examines the sustainability and reliability of reported EPS figures by analyzing the underlying business drivers, cash flow generation, accounting policies, and reporting transparency. This analysis helps investors distinguish between high-quality, sustainable earnings and potentially manipulated or unsustainable figures.
EPS in different market conditions
The interpretation and significance of EPS can vary significantly depending on prevailing market conditions and economic environments. Understanding these variations helps investors adapt their analysis and make more appropriate investment decisions.
- Bull markets typically see investors focus more on EPS growth rates and future earnings potential rather than absolute EPS levels. In the Vietnamese market, for instance, a projected 20% EPS growth for the VN-Index in 2025 indicates a strong focus on growth potential during optimistic market conditions. Companies with strong EPS growth often command premium valuations as investors prioritize growth over current profitability levels.
- Bear markets generally shift investor focus toward absolute EPS levels and earnings stability rather than growth potential. During challenging market conditions, such as periods of net foreign outflows and potential risks in key sectors in Vietnam, companies with consistent, reliable EPS figures often outperform those with volatile or declining earnings, regardless of their growth potential.
- Economic cycles significantly impact EPS interpretation, as different industries and companies respond differently to economic expansion and contraction. In Vietnam, cyclical sectors like banking and real estate significantly influence the VN-Index and often show dramatic EPS swings that reflect broader economic conditions. Cyclical companies may show dramatic EPS swings that reflect economic conditions rather than management performance, while defensive companies might maintain more stable EPS patterns.
- Interest rate environment affects EPS valuation through its impact on discount rates and alternative investment opportunities. Higher interest rates typically reduce the present value of future earnings, making high-EPS companies less attractive relative to fixed-income investments.
Earnings Per Share (EPS) remains one of the most fundamental and important metrics for evaluating company financial performance and making informed investment decisions. The key to successful EPS analysis lies in understanding both its strengths and limitations, using it in conjunction with other financial metrics, and adapting the analysis to specific market conditions and investment goals. By following the principles and techniques outlined in this guide, investors can harness the power of EPS to make more informed decisions and build more successful investment portfolios.

