 Delaware (USA)
  Vietnam
  Singapore
  Hong Kong
  United Kingdom
 To truly gauge the effectiveness of an investment strategy, professionals look beyond raw numbers to a more insightful metric: Excess return. Understanding this concept is not just academic; it is a critical tool for any serious investor, financial analyst, or corporate finance professional aiming to make informed, performance-driven decisions. This comprehensive guide will explore the definition, finance, formulas of calculation, and practical examples.
This article outlines the key aspects of excess return to help businesses and investors gain a clearer understanding of its sources and how it differs from other performance-related metrics. We specialize in company formation and do not provide financial advice. For financial matters, please consult a qualified expert.
What is excess return?
At its core, excess return is the return an investment generates above and beyond a specific benchmark. This benchmark acts as a yardstick, representing a standard or expected level of performance. The excess return, therefore, quantifies how much an investment has outperformed or underperformed this standard. It provides a measure of the value added (or subtracted) by an investment manager or strategy.
The concept is versatile, and the choice of benchmark is critical as it sets the context for the evaluation. Common benchmarks include:
- The risk-free rate: This is the return an investor could expect from an investment with virtually zero risk, typically represented by the yield on government securities like U.S. Treasury bills. Comparing an investment's return to the risk-free rate tells you the reward earned for taking on any level of investment risk, often referred to as the risk premium or excess return over the risk-free rate.
- Market indices: These are curated portfolios of securities representing a particular segment of the market. For a portfolio of large-cap U.S. stocks, the S&P 500 would be an appropriate benchmark. For a tech-focused fund, the NASDAQ 100 might be more suitable. Using a market index as a benchmark helps determine if an investment has beaten the average performance of its peers or the market it operates in.
- Industry-specific indices: For specialized portfolios, such as those focused on real estate or biotechnology, a relevant industry index provides the most accurate comparison.
To make the concept more accessible, consider an analogy. Imagine a professional marathon runner. Their raw time for finishing a race is their "total return." However, to gauge their performance, we need context. Did they beat the course record? That's their excess return against a specific benchmark. Did they beat their own personal best time? That's an excess return against a different benchmark. Simply finishing the race is not the full story; the real measure of success is how they performed relative to a meaningful standard. The result of an excess return calculation can be interpreted in three ways:
- Positive excess return: The investment has outperformed its benchmark, indicating a successful strategy for the period measured.
- Negative excess return: The investment has underperformed its benchmark, even if its raw return was positive.
- Zero excess return: The investment's performance matched the benchmark exactly.
The importance of excess return in investing
The pursuit of positive excess return is the fundamental goal of active investment management. This metric is not just a performance score; it is a vital input that informs strategy and decision-making in several key areas.
- Performance measurement: Excess return offers a more sophisticated and honest assessment of performance than raw returns alone. A 10% return might seem impressive in isolation, but if the benchmark returned 12%, the strategy has actually underperformed. It provides a clear measure of a portfolio manager's ability to generate returns above the market average, serving as a key tool for evaluating their effectiveness.
- Investment decision support: When choosing between different investments, such as two different mutual funds, excess return provides a powerful point of comparison. For instance, Fund A might have a total return of 15% and Fund B a return of 12%. On the surface, Fund A looks superior. However, if Fund A's benchmark returned 14% (an excess return of +1%), while Fund B's more conservative benchmark returned 8% (an excess return of +4%), an investor might conclude that Fund B's manager demonstrated superior skill in their respective category.
- Evaluating fund managers' skill: A primary challenge for investors is distinguishing between a manager's skill and sheer luck or simply "riding the wave" of a strong bull market. An analysis of excess return can help determine whether outperformance is the result of a portfolio manager's skill or simply the result of movements in the stock markets. When consistently achieved over time, positive excess return (especially when adjusted for risk, as we will see with alpha) is a strong indicator of genuine expertise.
- Foundation of Modern Portfolio Theory (MPT): The concept of excess return is a cornerstone of MPT, a Nobel Prize-winning framework for building diversified portfolios. It is a critical component in calculating the Sharpe ratio, a widely used measure of risk-adjusted return. MPT uses the relationship between risk and excess return to identify an "efficient frontier," which represents the set of optimal portfolios that offer the highest expected return for a given level of risk.
How to calculate excess return: Key formulas
Calculating excess return can range from a simple subtraction to a more complex, risk-adjusted formula. The method used depends on the level of analytical depth required.
The basic formula
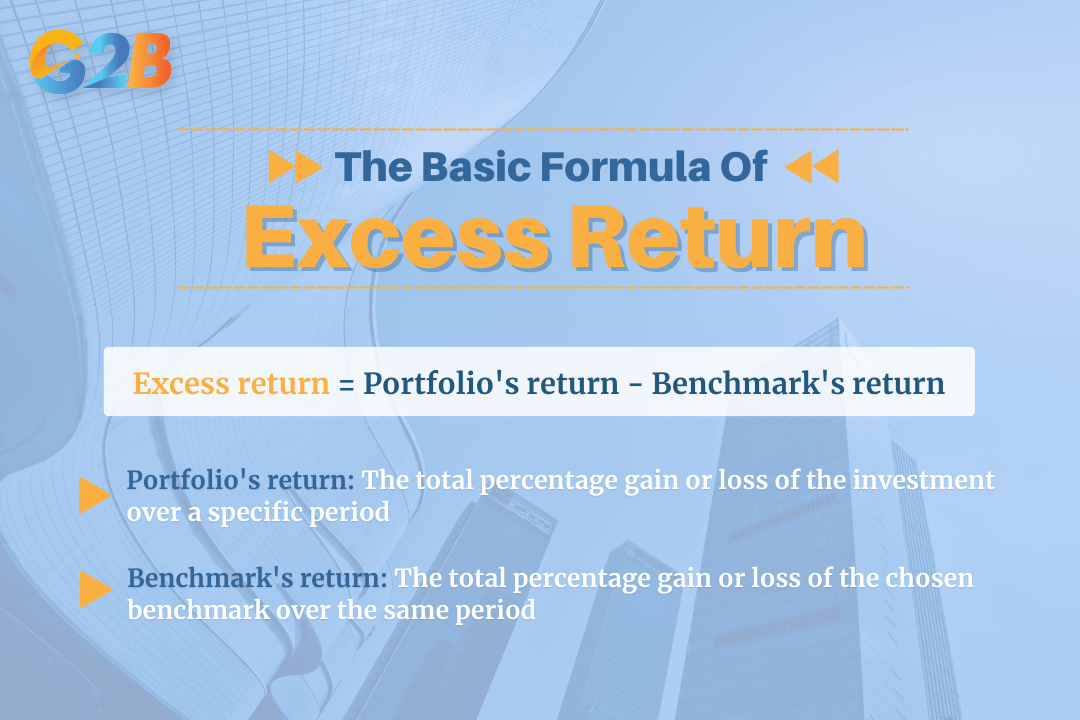
The most straightforward way to calculate excess return is to subtract the benchmark's return from the portfolio's total return.
Formula: Excess return = Portfolio's return - Benchmark's return
- Portfolio's return: The total percentage gain or loss of the investment over a specific period.
- Benchmark's return: The total percentage gain or loss of the chosen benchmark over the same period.
Example: An investor's portfolio earns a 14% return over one year. The benchmark, the S&P 500, returns 11% over the same year.
- Excess return = 14% - 11% = 3% The portfolio achieved a positive excess return of 3%.
The basic formula of the excess return
Calculating excess return against the risk-free rate
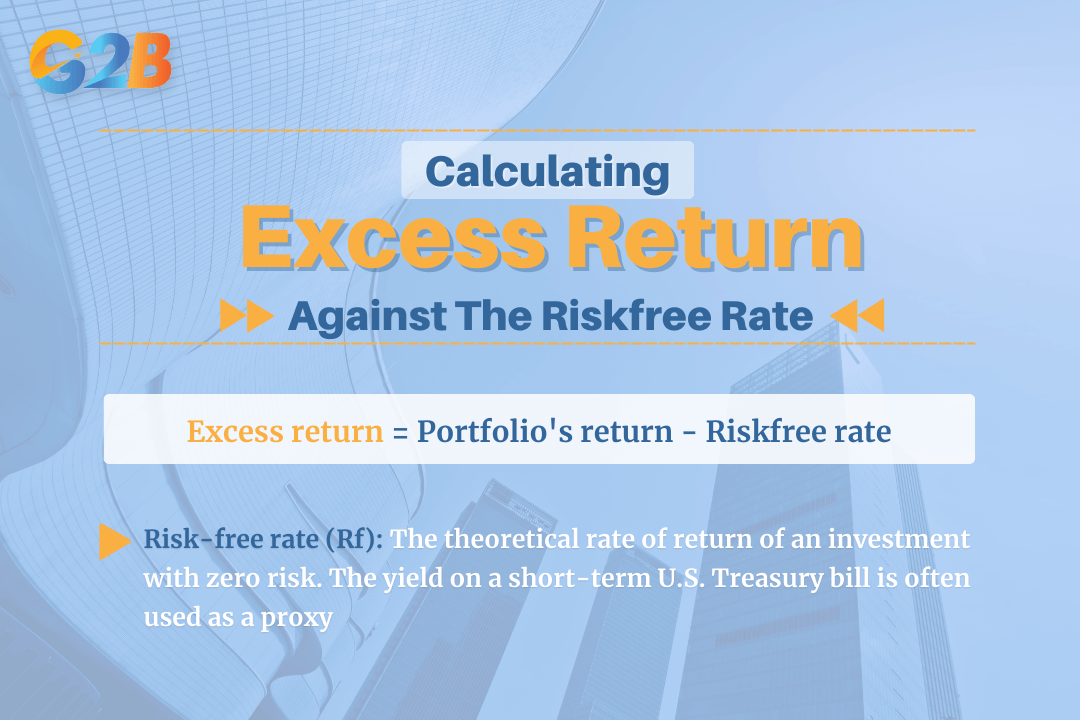
This is a fundamental calculation that measures the reward an investor receives for taking on any level of market risk above a guaranteed return.
Formula: Excess return = Portfolio's return - Risk-free rate
- Risk-free rate (Rf): The theoretical rate of return of an investment with zero risk. The yield on a short-term U.S. Treasury bill is often used as a proxy.
Example: A stock portfolio generates a return of 15% in a year. During that same year, the U.S. Treasury bill yields 2%.
- Excess return = 15% - 2% = 13% The portfolio compensated the investor with a 13% return for taking on the risks of the stock market.
Calculating excess return against the risk-free rate
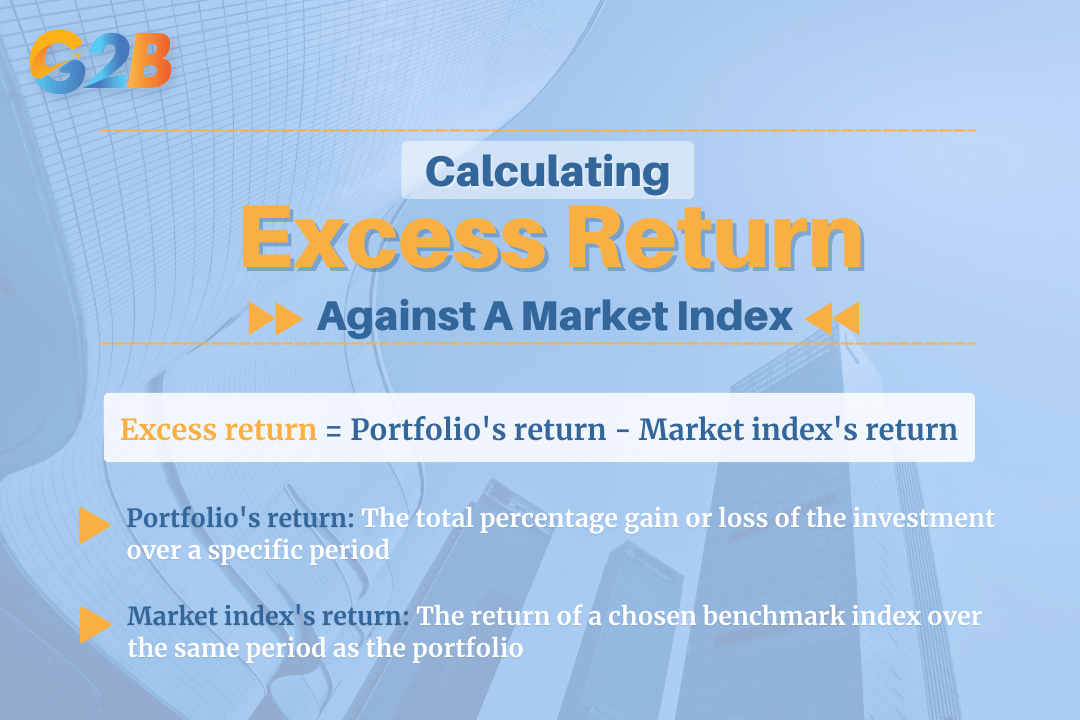
Calculating excess return against a market index
This is the most common application for evaluating actively managed funds. It answers the question: "Did the manager beat the market?"
Formula: Excess return = Portfolio's return - Market index's return
Example: A mutual fund focused on U.S. large-cap stocks returns 9.5% for the year. Its designated benchmark, the S&P 500, returns 10.2% in that same period.
- Excess return = 9.5% - 10.2% = -0.7% Despite a positive raw return, the fund manager underperformed the market, resulting in a negative excess return.
Calculating excess return against a market index
The advanced formula: Risk-adjusted excess return (CAPM)
While the basic formula is useful, it doesn't account for the level of risk taken to achieve the return. This is where the Capital Asset Pricing Model (CAPM) becomes essential. CAPM provides an expected return for an asset based on its systematic risk (risk that cannot be diversified away). The excess return calculated using this model is known as Alpha.
First, we must calculate the expected return using the CAPM formula:
CAPM formula: Expected return (ER) = Rf + β * (Rm - Rf)
- Rf: The risk-free rate.
- β (Beta): A measure of a stock's volatility in relation to the overall market. A beta of 1 means the stock moves with the market. A beta above 1 indicates greater volatility, while a beta below 1 indicates less volatility. Note: Beta only captures systematic risk, excluding idiosyncratic (unsystematic) risk.
- Rm: The expected return of the market (e.g., the historical average return of the S&P 500).
- (Rm - Rf): This is the Market Risk Premium, the excess return investors expect for investing in the market as a whole instead of a risk-free asset.
Once the expected return is calculated, you can find the risk-adjusted excess return, or Alpha.
Alpha formula: Alpha (α) = Actual return - Expected return
Step-by-step example: Let's analyze a portfolio with the following characteristics:
- Actual annual return: 18%
- Portfolio Beta (β): 1.4 (meaning it's 40% more volatile than the market)
- Risk-free rate (Rf): 3%
- Expected market return (Rm): 11%
Step 1: Calculate the expected return using CAPM.
- Expected return = 3% + 1.4 * (11% - 3%)
- Expected return = 3% + 1.4 * (8%)
- Expected return = 3% + 11.2%
- Expected return = 14.2%
Step 2: Calculate the alpha.
- Alpha = 18% (Actual return) - 14.2% (Expected return)
- Alpha = +3.8%
This positive alpha of 3.8% indicates that the portfolio manager generated returns that were 3.8% higher than what would be expected, given the high level of risk (beta of 1.4) they undertook.
The relationship between excess return and risk
In finance, the concepts of return and risk are inextricably linked. The fundamental principle is that investors demand higher potential returns for taking on greater risk. This additional compensation is known as the Risk premium. The excess return of an asset over the risk-free rate is essentially the realized risk premium. The expected excess return is the risk premium that investors anticipate earning in the future.
Because raw excess return doesn't tell the whole story about risk, analysts use several risk-adjusted performance metrics that build upon this concept:
- The Sharpe ratio: Perhaps the most famous risk-adjusted metric, the Sharpe Ratio measures the excess return (over the risk-free rate) per unit of total risk (as measured by standard deviation). A higher Sharpe Ratio indicates a better risk-adjusted performance; the investment generated more return for each unit of risk it took on.
- The Treynor ratio: Similar to the Sharpe Ratio, the Treynor Ratio also uses excess return in its numerator. However, its denominator uses Beta, measuring excess return per unit of systematic (market) risk. This makes it particularly useful for evaluating how a single security might affect a well-diversified portfolio.
Mastering the concept of excess return is a fundamental step toward becoming a more strategic and analytical investor. It moves the evaluation of performance beyond misleading headline numbers to a more insightful, context-rich analysis. By comparing returns to appropriate benchmarks, adjusting for risk, and understanding the nuances between simple excess return and true alpha, investors can better assess the value of their strategies and the skill of their managers. For entrepreneurs looking to register a company in Vietnam, this knowledge can also provide a strong foundation for making informed financial decisions and building sustainable business growth.